Seeds of Time: Technology Forecasting
Bala Ramadurai
2026
Meet Your Facilitator - Prof. Bala Ramadurai
Meet Your Facilitator - Bala Ramadurai
Entrepreneur, Professor, Author and Innovation Coach

- Marie Curie Research Fellow at Politecnico di Milano, Milan, Italy
- PhD from Arizona State University, USA (Materials)
- BTech from IIT Madras, India (Metallurgy)
Prof. Bala Ramadurai - Professor
- IIT Madras, Chennai, India
- Universidad Panamericana, Mexico City, Mexico
- Symbiosis Institute of Business Management, Pune, India
Bala Ramadurai - Author
 |
 |
 |
 |
Bala Ramadurai - Innovation Coach

Bala Ramadurai - Entrepreneur
![]()
Spirelia
Innovate with Confidence
Srishti OS — The AI-Native Innovation Platform
Spirelia Innovation Pvt. Ltd.
"Innovate with Confidence, Powered by Insight"
& Roadmapping
Assistant
& Idea Generation
Protection
Prototyping
Courses Taught
Design Thinking
Human Centred Design of products and services
Innovate Like a Boss
Systematic Innovation using methodologies like TRIZ, Brainstorming
Technology Forecasting
![]()
Quick Sensing of the Room
- Show of hands — Who here is primarily in R&D? Production? Testing? Management?
- Show of hands — Who has been involved in forecasting or roadmapping before?
- Shout it out — AI is not an acceptable answer: what technology will quietly dominate defence by 2035?
If you can look into the seeds of time, And say which grain will grow and which will not
- From Macbeth, Act I, Scene 3
Why Tech Forecasting Now?
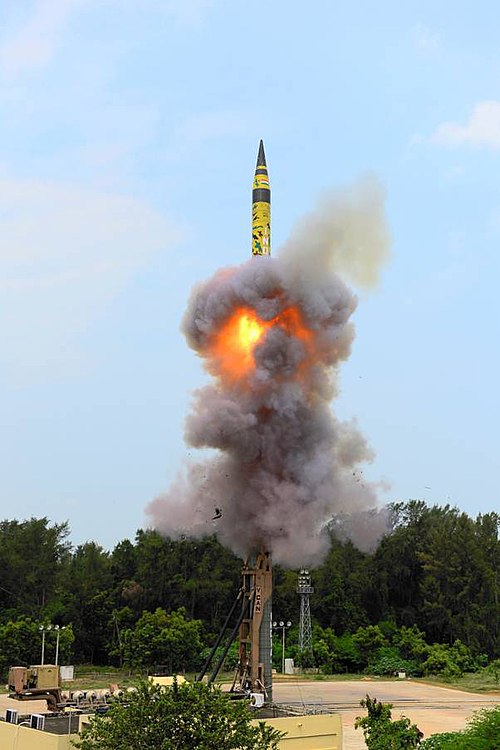
1975: DRDO forecast India's missile needs
MTCR denial came too late — foundations were built
"No technology control regime can derail our missiles"
When we forecasted — we withstood denial.
Image: Wikimedia Commons (CC BY), DRDO/Govt. of India
Intro to Technology Forecasting
What is Technology Forecasting?
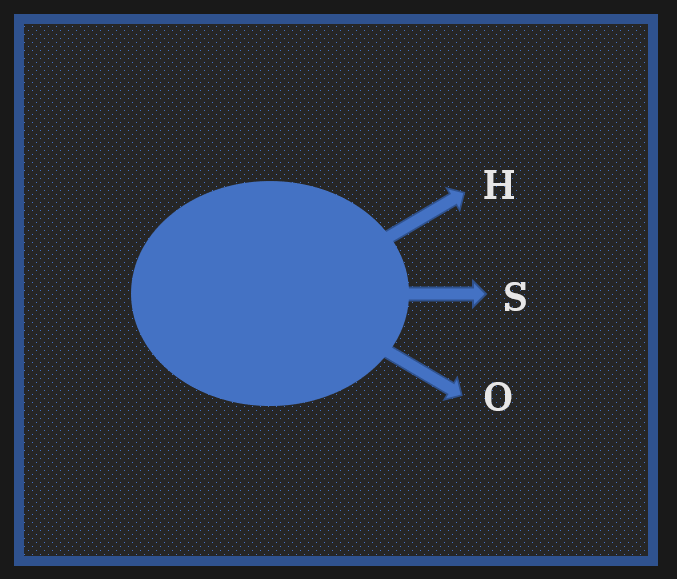
Technology

- Hardware (The physical)
- Software (The virtual)
- Orgware (The rules/knowledge)
Technology = Hardware + Software + Orgware
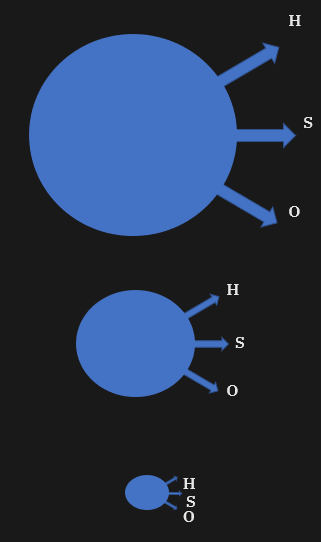
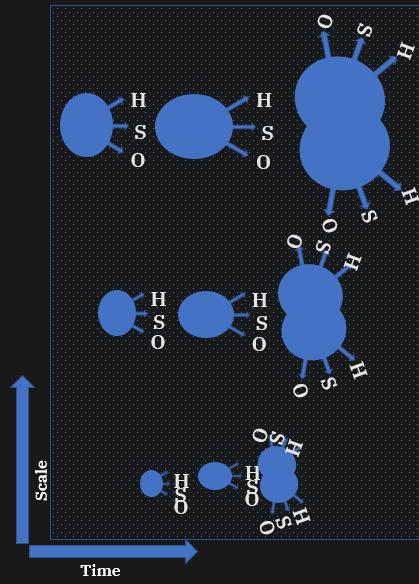
Forecasting
- time
- scale
Time

Scale
Why Technology Forecasting?
Technologies operate in a context
- Organizational context
Why Technology Forecasting?
- Move from invention to innovation
- Increase effectiveness of our efforts
- Work with limited resources
Technology Forecasting is Strategic Decision Making
How do we forecast technologies?
- Step 1: Formulate the tech forecasting project
- Step 2: Model the system
- Step 3: Act on the data
- Step 4: Transfer the results
Note - Model here is curve fitting of parameters of the forecast, in the context of the tech forecasting project
Step 1: Formulate the project
- Pose the questions that you seek answers to in the organizational context
- The questions should contain these three:
- what
- when
- where
- Get the buy-in of the beneficiaries/decision makers
- Example - Will vacuum forming technologies be needed in the future (20 years, 2013-2033) for Whirlpool products (Refrigerators) in factories in Europe?
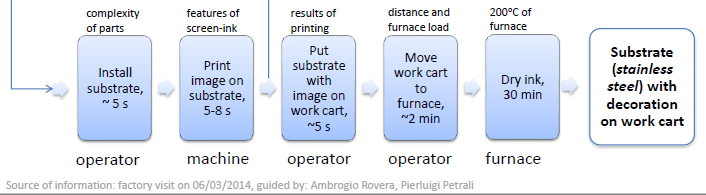
Step 2: Model the system
- Understand how the system works
Determine the critical parameters
Step 3: Act on the data
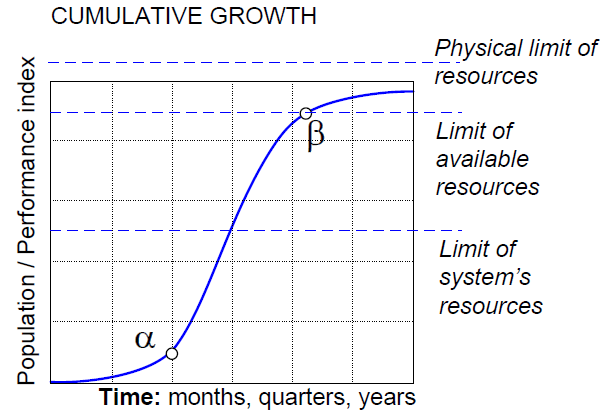
Use critical parameter data from databases and model them into an s-curve (logistic)
Step 4: Transfer the results
Present the answers of questions from Step 1 to the beneficiaries/decision makers
- Example - Will vacuum forming technologies be needed in the future (20 years, 2013-2033) for Whirlpool products (Refrigerators) in factories in Europe?
- Answer:
- Yes, vacuum forming will be needed for Whirlpool in factories in Europe
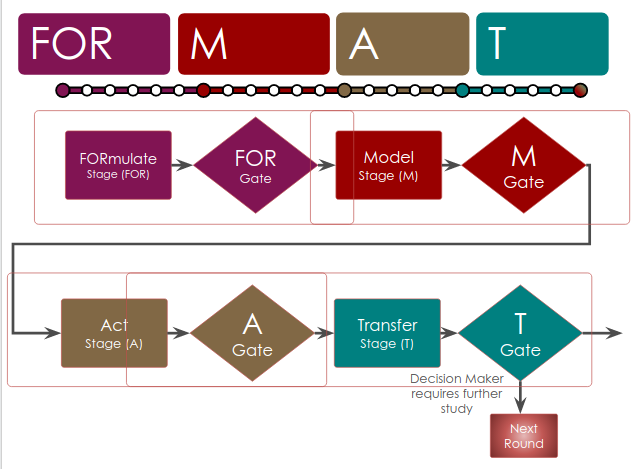
Remember FOR.M.A.T

- FORmulate
- Model
- Act
- Transfer
Note - Model here is curve fitting of parameters of the forecast in the context of the tech forecasting project
Source - G. Cascini, B. Ramadurai, et al. https://handbook.format-project.eu
An example - Weapon Locating Radars
Note - This example for illustrative purposes only, not to be taken literally
Sample Case: Future-Ready Weapon Locating Radars
Organizational Context
- Design & develop advanced radar systems
- Support Tri-Services & other defense forces
- Establish indigenous production capabilities
Why It Matters
- Informs R&D investments
- Enhances force protection
- Enables effective counter-battery operations
Technology Forecasting
FORmulate
- Identify the system - WLR
- Formulate the questions to be answered in the organisation context
- Example - How accurately and quickly will future weapon locating radars be able to detect and respond to hostile artillery across diverse terrains and contested electronic environments over the next 10-15 years (2026-2041)?
- Tip - You could break down a complex questions into sub-questions
- Identify the roles of the team members - One leader per stage
Scenarios
Pick a project from your own domain that you want to perform a forecast on
Teams
- Pair or team up with someone in a similar domain as yours
Tasks for You
- Get to know your team
- Get to know your theme
- Perform FORmulate steps
Time remaining:
Self-evaluate: FORmulate
[ ]1 mark for clearly identifying your system[ ]1 mark for defining the organizational context[ ]2 marks for a well-formed forecast question containing what, when, and where[ ]1.5 marks for breaking the question into sub-questions[ ]1.5 mark for identifying team roles (one leader per stage)
Model
Note - Model here is curve fitting of parameters of the forecast in the context of the tech forecasting project
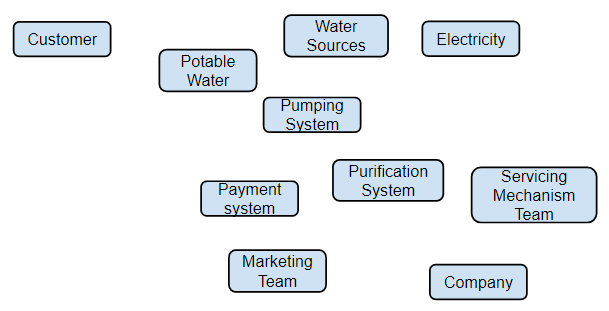
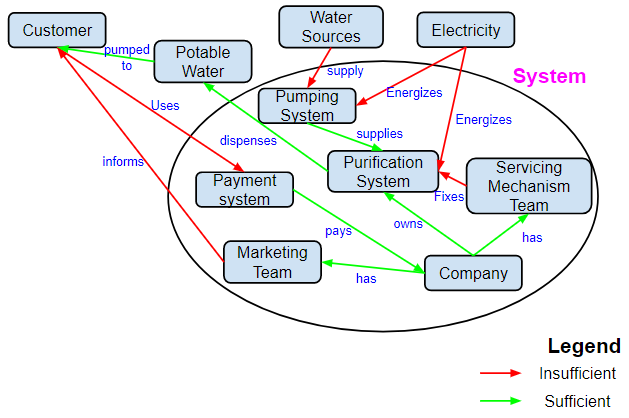
Water Case study
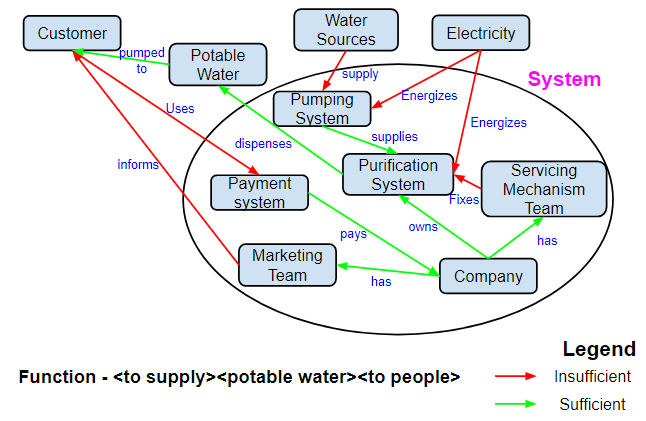
The hydro-distribution infrastructure, conceptualized to effectuate conveyance of sanitized aqueous sustenance to anthropological end-consumers, encompasses interdependent subsystems. The hydraulic propulsion mechanism, energized through insufficiently robust electrochemical current provisioning, receives tributaries from suboptimally adequate hydrological repositories. Said apparatus channels aqueous material to a contaminant-elimination subsystem—this interrelationship being satisfactorily operational—maintained through ameliorative interventions by a servicing mechanism team, itself reliant upon insufficient electrochemical energization. A pecuniary transaction apparatus interfaces with end-consumers for informational dissemination and resource dispensation, both linkages presently inadequate. The corporate entity exercises proprietorial dominion over purification, maintains the servicing team, remunerates a commercial promotion division, while treated aqueous output is hydrostatically conveyed to end-consumers through an insufficiently performant pipeline.
Quiz
- What are the weak points in the system?
- What does the company control?
- What are some external factors that are not easily controlled?
Visual report
Quiz
- What are the weak points in the system?
- What does the company control?
- What are some external factors that are not easily controlled?
Imagine conveying your best idea(s) through words alone

Words can be ambiguous. We need a visual tool to capture our system.
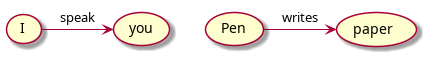
Function Analysis
I speak to you
| I | Subject (Doer) |
| speak | Verb (Deed) |
| you | Object (Recipient of the Deed) |
Pen writes on paper
| Pen | Subject (Doer) |
| writes | Verb (Deed) |
| paper | Object (Recipient of the Deed) |
Visually
How do we describe a system visually?
Step 1: List Objects of the System
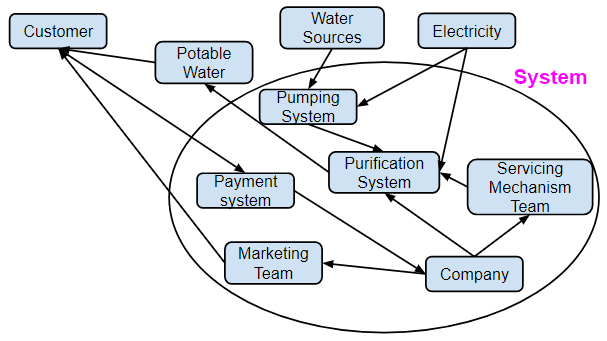
Step 2: Connect the Objects
Step 3: Add verbs to the relationships
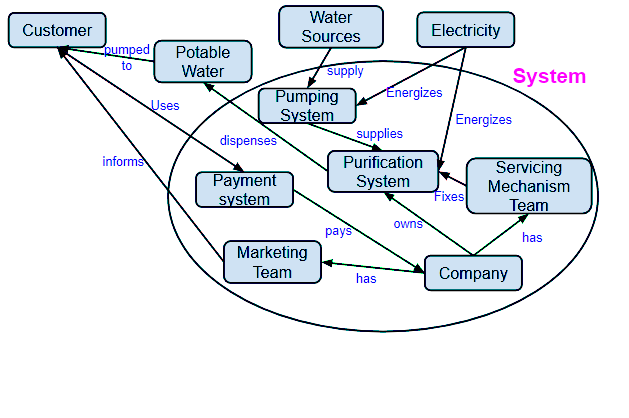
Step 4: Classify the relationships and add a legend
Step 5: Write the function
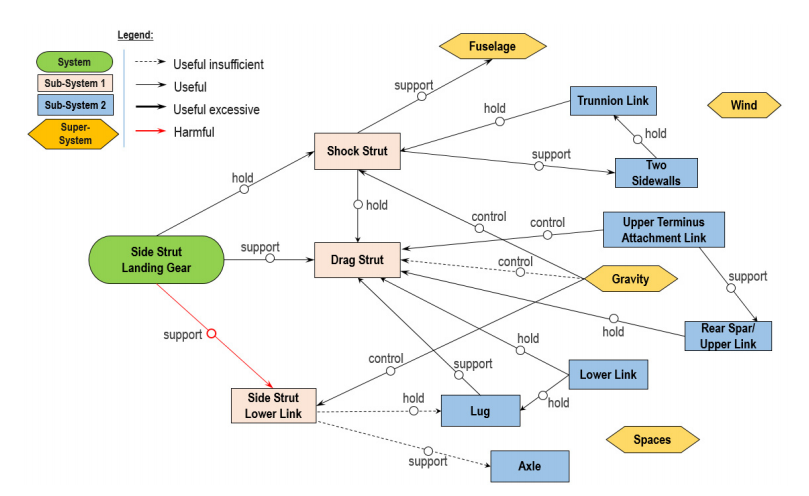
Source - Kamarudin et al, Procedia Engineering 131 ( 2015 ) 1064 – 1072
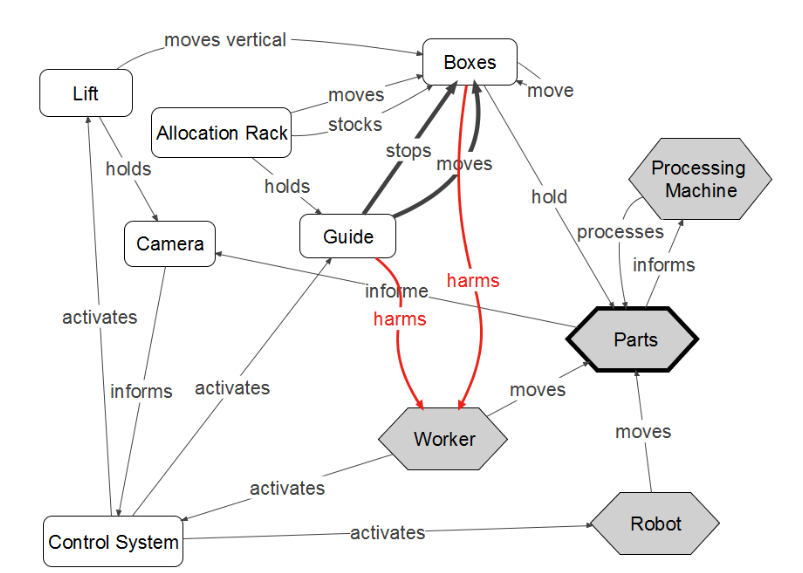
Source - https://triz-journal.com/case-study-with-triz-allocation-system-for-a-processing-machine/
Functional Analysis - The procedure
- List Objects of the System
- Connect the Objects
- Add verbs to the relationships
- Classify the relationships and add a legend
- Write the function
For our case: WLR
WLR Objects — Internal Subsystems
WLR Internal Components
- Antenna Array (transmits/receives radar signals)
- Signal Processor (extracts target data from returns)
- Trajectory Computer (calculates origin point)
- Data Link / Comm Unit (sends data to C2)
- Power Supply (powers all subsystems)
- Operator Console (human-machine interface)
External Objects
- Incoming Projectile (Target)
- Hostile Artillery (Source)
- Friendly Artillery (Counter-Battery)
- Command & Control System
- Battlefield Environment
- Electronic Warfare Systems
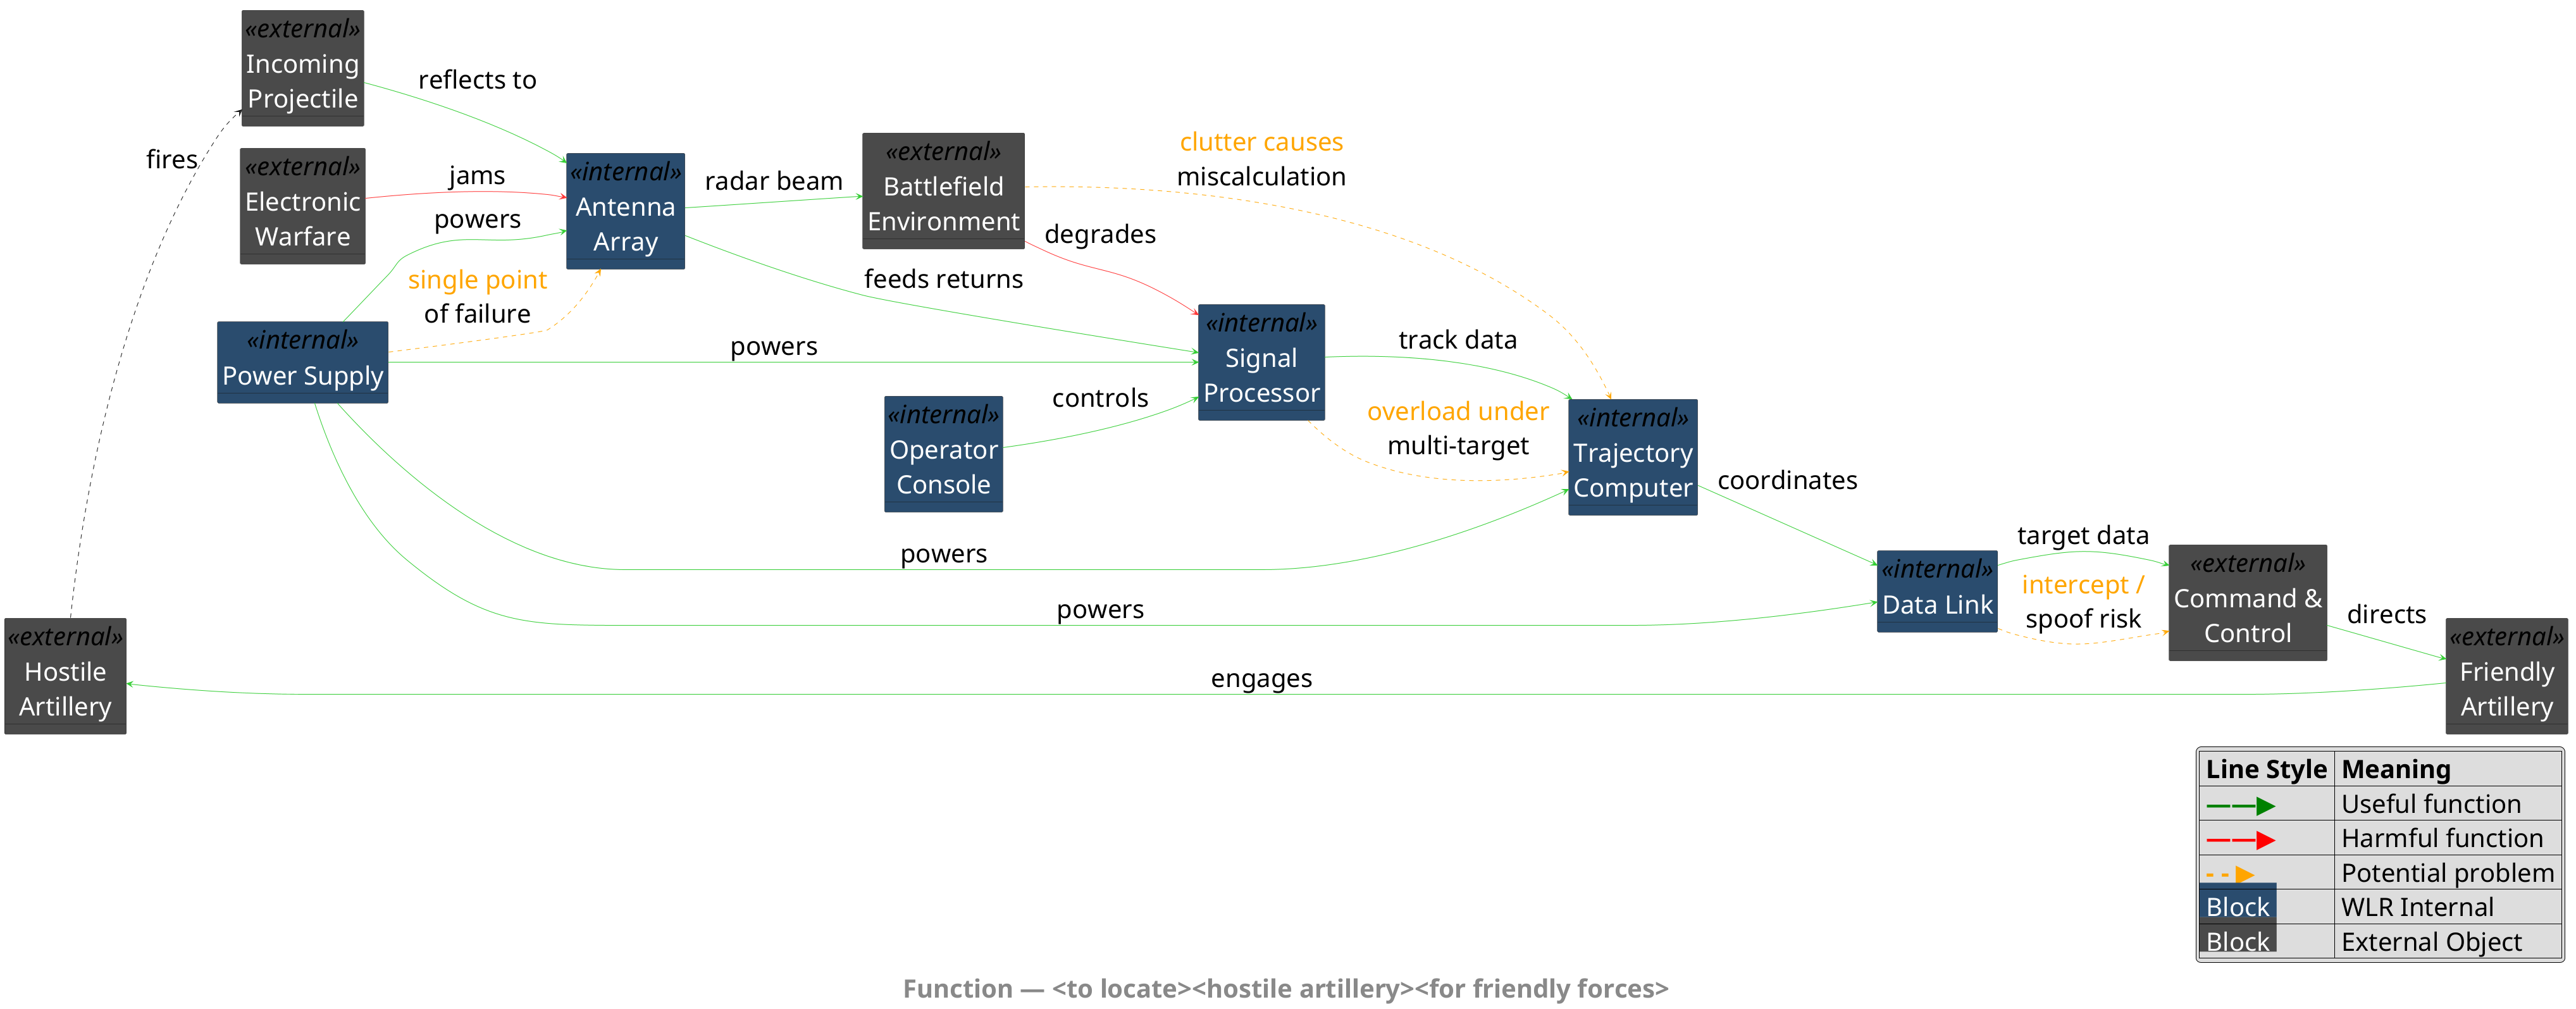
WLR Connections (Illustrative)
Internal
- Antenna Array transmits radar beam into Battlefield Environment
- Incoming Projectile reflects signals to Antenna Array
- Antenna Array feeds raw returns to Signal Processor
- Signal Processor sends track data to Trajectory Computer
- Trajectory Computer sends coordinates to Data Link
- Data Link transmits target data to C2
- Operator Console monitors Signal Processor
- Power Supply energises all internal subsystems
External
- C2 directs Friendly Artillery
- Friendly Artillery engages Hostile Artillery
- Electronic Warfare Systems jam Antenna Array
- Battlefield Environment (clutter) degrades Signal Processor
WLR - FA diagram
Task - Functional Analysis
- Start with your current system
- Perform functional analysis
- What (all) would you like to improve in the system? - Optional for this workshop
Time remaining:
Self-evaluate: Functional Analysis
[ ]1 mark for listing all key objects of your system[ ]1 mark for connecting the objects with relationships[ ]1 mark for adding verbs (actions) to each relationship[ ]2 marks for classifying relationships (useful, harmful, insufficient)[ ]1 mark for writing at least one complete function statement[ ]1 mark for identifying what you would like to improve
Recap
This is not part of our workshop, but is the next step
- What all would you like to improve in the system?
- Answer: top 2 parameters
- Target Localisation Error (metres)
- Time-to-Engagement (seconds)
Act

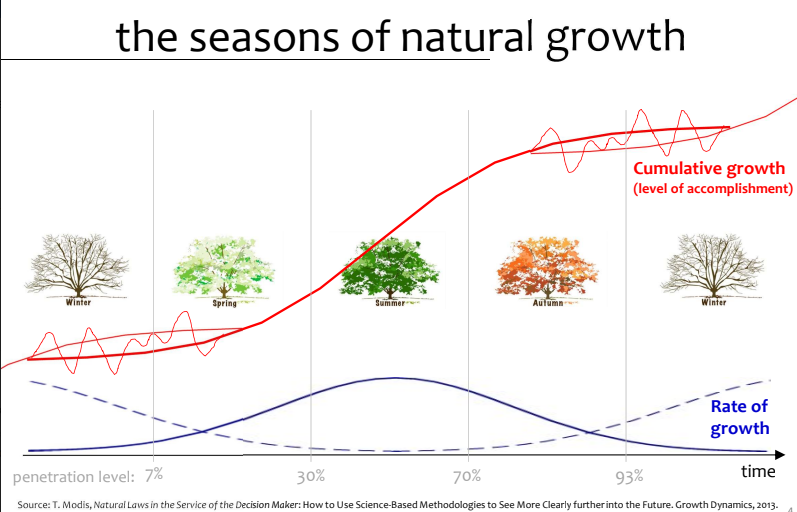
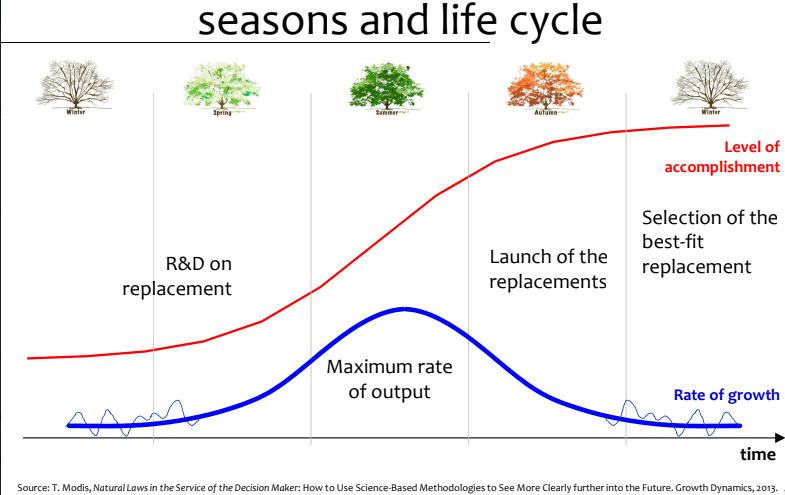
4 seasons model
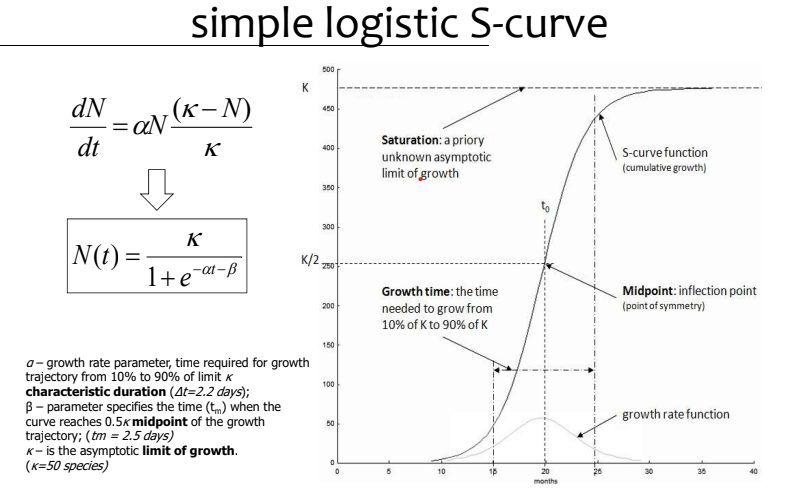
Quantitative curve-fitting of critical parameters
| Year | Target Localisation Error (m) |
|---|---|
| 1995 | 150 |
| 2000 | 120 |
| 2005 | 90 |
| 2010 | 60 |
| 2015 | 35 |
| 2020 | 20 |
| 2023 | 15 |
Note - This example for illustrative purposes only, not to be taken literally
Why do we normalize?
- The S-curve models cumulative growth (improvement over time)
- But our raw data shows error decreasing from 150m to 15m
- We invert: convert "error reducing from 150 to 15" into "improvement growing from 0 to 135"
- Formula: Improvement = Initial Value - Current Value
- This gives us a monotonically increasing series that the logistic curve can fit
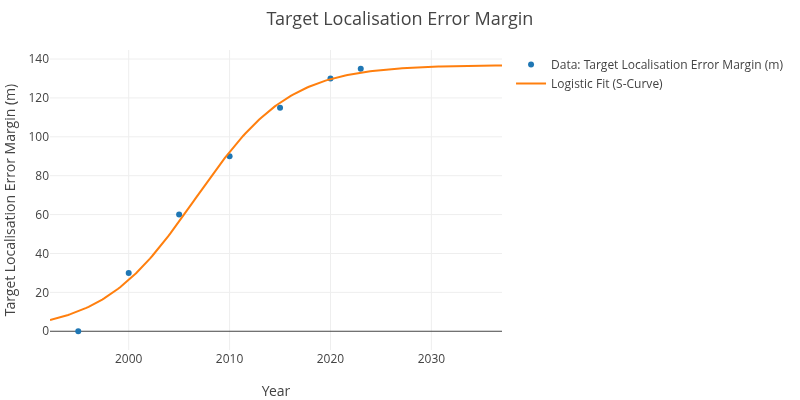
Normalization before we fit logistic
| Year | Target Localisation Error Margin (m) |
|------+--------------------------------------|
| 1995 |                                    0 |
| 2000 |                                   30 |
| 2005 |                                   60 |
| 2010 |                                   90 |
| 2015 |                                  115 |
| 2020 |                                  130 |
| 2023 |                                  135 |
Fit the data into Spirelia's s-curve software - UtkarshaSigmoid
- Copy and paste the data into UtkarshaSigmoid
- Note down the predictions, tm = time of maximum growth rate
- Note down the value of K (estimated saturation point or minimum achievable error)
Median and forecast
- K (Saturation Point / Minimum Error): Approximately 5 metres
- tm (Time of Maximum Growth Rate): Approximately 2007
Strategic Interpretation: So What?
- K = 5m means the technology is approaching its physical limit for this generation
- tm = 2007 means we passed the inflection point nearly two decades ago – we are deep in the diminishing-returns zone
- Strategic implication: Diminishing returns on current WLR approach
- Decision: Invest in next-generation approaches (e.g., multi-sensor fusion, AI-assisted tracking) rather than incremental improvement of existing radar
Tasks for you
- Identify the variable for s-curve fitting from your system
- Use the data table provided by the facilitator (or use the WLR example data)
- Normalize the data (Improvement = Initial Value - Current Value)
- Draw a grid on plain paper, plot the normalised data, and sketch the S-curve
- Mark tm (steepest point) and K (saturation level) on your graph
- Discuss with your team: What does your tm and K tell you strategically?
Time remaining:
Self-evaluate: Act
[ ]1 mark for identifying the right variable for s-curve fitting[ ]1 mark for correctly normalizing the data[ ]1 mark for drawing a grid and plotting the data points[ ]1 mark for sketching a smooth S-curve and marking tm and K[ ]2 marks for interpreting what tm and K mean for your system's future
Transfer
Checklist for Transfer
- ✅ Answer the Question to be Forecasted
- ✅ Executive summary
- ✅ Report
- ✅ Presentation
Executive Summary Format
- Strategic Question: What we set out to forecast
- Key Finding: The S-curve parameters (tm, K) and what they mean
- Implication: What this means for our R&D roadmap
- Recommendation: Specific actions to take
- Confidence & Limitations: Data quality and assumptions
Some tips for Transfer
- Lead with the strategic question, not the math
- Refresh your beneficiaries' memory about the case
- Use a maximum of 5+/-2 objects in every slide
- Try to convey your message visually
Handling Pushback
- "What if the forecast is wrong?"
- All forecasts have uncertainty – the value is in structured thinking, not precision
- The S-curve provides a baseline; scenario planning handles the rest
- "Our technology is different"
- Every technology follows lifecycle patterns – the question is where you are on the curve
- "We don't have enough data"
- Even 4-5 data points can reveal a trend; the alternative is pure guesswork
Tasks for you
- Complete the presentation
- Invite your beneficiary from the other team
- Present the results to the beneficiary
- Seek feedback
- Improve presentation
Final Self-Evaluation: Your FORMAT Journey
| Activity | Phase | Your Score | Max |
|---|---|---|---|
| FORmulate | FOR | _ | 7 |
| Functional Analysis | Model | _ | 7 |
| S-Curve Fitting | Act | _ | 6 |
| Total | _ | 20 |
- 16-20: You've internalized FORMAT - ready to forecast!
- 10-15: Solid foundation - one more practice cycle will sharpen your skills
- 0-9: Review the concepts and try the activities again with your team
AI in Technology Forecasting
How can AI assist in Technology Forecasting?
- FORmulate: AI can help scan literature, identify trends, and refine research questions
- Model: AI can extract system components and suggest functional relationships
- Act: AI can gather time-series data, fit curves, and interpret parameters
- Transfer: AI can draft executive summaries, generate reports, and prepare presentations
AI is a Co-pilot, Not a Replacement
- Domain expertise remains essential – AI doesn't know your organizational context
- AI accelerates the process, but you must validate the outputs
- The FORMAT methodology provides the structure; AI provides the speed
Demo: Utkarsha – FORMAT Forecaster
- AI-powered assistant that guides you through the entire FORMAT workflow
- Conversational interface – ask questions, get structured guidance
- Built-in tools: STEEP Analysis, Scenario Builder, Impact Assessment, Strategic Options
- Generates professional reports (PDF, PPTX, DOCX) from your forecasting session
Live Demo
Let's walk through a forecasting project together using Utkarsha
Key Utkarsha Features
- AI Coaching: Contextual suggestions at every FORMAT stage
- Document Analysis: Upload papers, reports – AI extracts relevant data
- ATRA Roadmapping: AI-suggested technology architecture and dependency mapping
- S-Curve Fitting: Integrated UtkarshaSigmoid for quantitative analysis
- Works online (cloud AI) or offline (local AI for sensitive environments)
Conclusion
We learnt this
Your Commitment
- What is one system you will apply FORMAT to within the next 30 days?
- Write it down now – and share with your team
- The best way to learn forecasting is to do a forecast
Now What?
①
Download the FORMAT handbook
http://handbook.format-project.eu

②
Register for SWAYAM/NPTEL Course

Registration will be open soon!
Your SWAYAM Instructors
 |
 |
| Prof. Dmitry Kucharavy | Prof. Bala Ramadurai |
Acknowledgments
- Emacs - this old editor rocks! - https://www.gnu.org/software/emacs/
- Spacemacs - this new configuration is space age - https://spacemacs.org
- Org Mode - I run my life using this - https://orgmode.org
- Reveal.js - cool presentation script - https://revealjs.com/
- Org-reveal package - lets me live in org-mode - https://gitlab.com/oer/org-re-reveal
- Org-teaching - original codebase for this presentation - https://gitlab.com/olberger/org-teaching
- Plantuml - for all the cartoon work - https://plantuml.com/
- Hugo - for converting into static html - https://gohugo.io
- Gitlab - for hosting my website and the presentations - https://gitlab.com
Acknowledgments
- Conversations with
- Prof. Dmitry Kucharavy, EM Strasbourg Business School, University of Strasbourg, France
- Prof. Gaetano Cascini, Politecnico di Milano, Milan, Italy
- Dr. Murali Loganathan, Spirelia
- European Union Marie Curie People Project
Meet Your Facilitator - Prof. Bala Ramadurai
Love to keep in touch
https://balaramadurai.net/about/
bala@balaramadurai.net
My LinkedIn

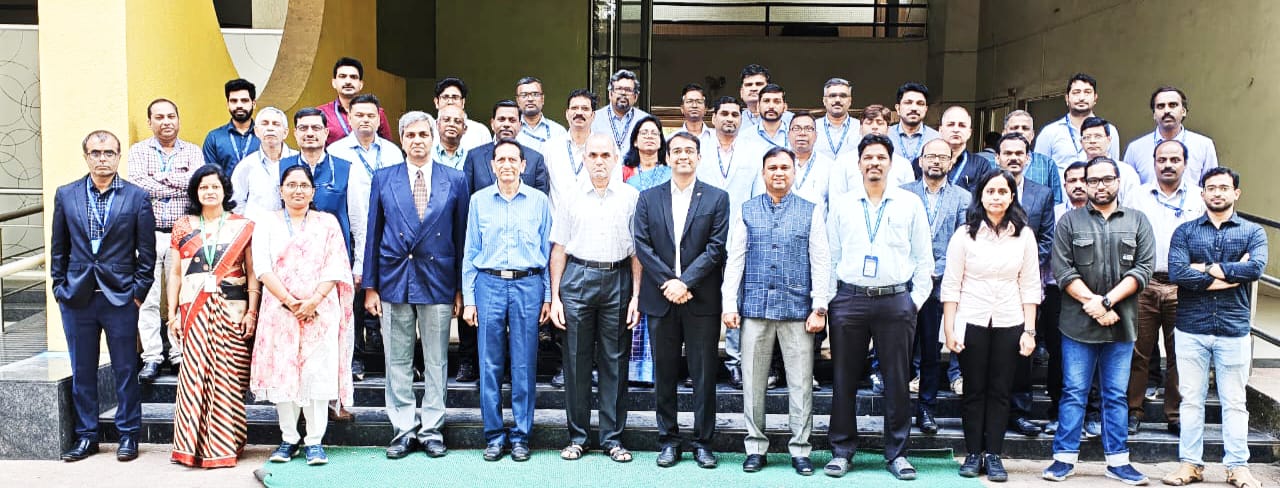
The Future Forecasters from the Past
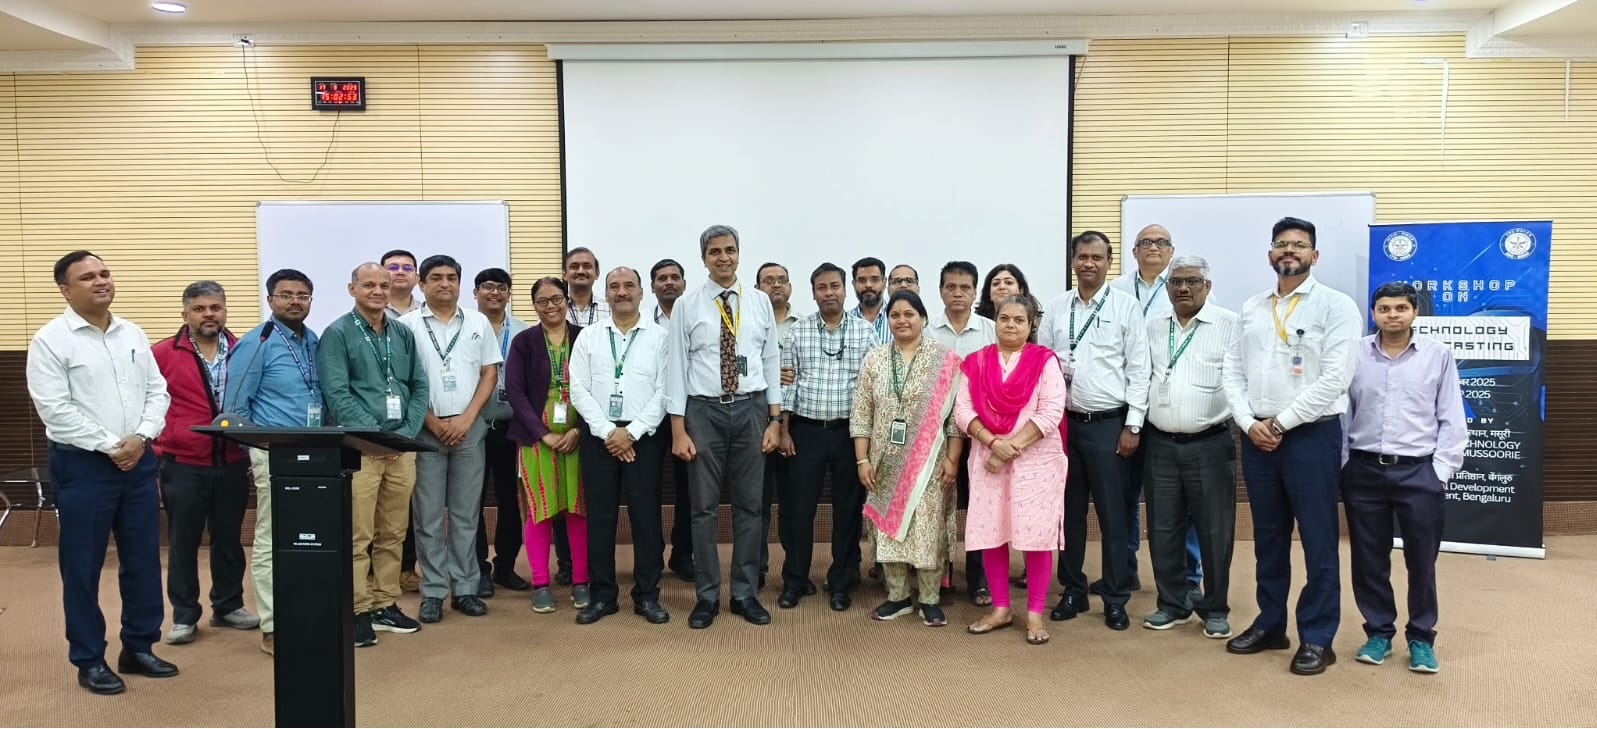
2025, ADE, Bengaluru
2025, DRDO scientists at IIT Bombay
2026, AVML, Avadi, Chennai
Oh and one more thing
Selfie
2026-DRDO-TF